

Building an effective early intervention plan for at-risk students
For institutions asking how to help at-risk students, the challenge is not agreeing that support matters. The challenge is building an intervention plan for at-risk students that is operational, cross-functional, and early enough to alter academic trajectory rather than simply document decline after the fact. It also requires institutions to consider whether they have enough trained faculty and staff to support students consistently, and whether the intervention process itself is framed in a way that students experience as supportive rather than punitive.
Recent national data show that early student continuation remains a significant concern. National Student Clearinghouse data released in 2025 show that, for students who began in fall 2023, 77.6% returned for their second year at either the same institution or a different one, while 69.5% returned to the same institution. This highlights why institutions need intervention plans for at-risk students that move beyond flagging risk and toward coordinated academic support before disengagement becomes attrition.
The strongest early intervention strategies help institutions move from scattered alerts to a shared understanding of student risk, targeted support, and measurable follow-up.
Why many student intervention efforts stall
Most institutions already use some form of academic intervention strategies. The challenge is not whether support exists. The challenge is whether that support is timely, targeted, and coordinated.
Without a connected view of student performance, institutions often run into the same problems:
- Risk is identified too late
- Faculty, advisors, and assessment teams work from different data sources
- Interventions are based on course grades alone rather than underlying competency gaps
- Remediation steps are assigned, but not consistently tracked
- Teams cannot easily evaluate which student intervention strategies are actually working
A stronger intervention plan begins with structure.
Define what “at-risk” means before students fall too far behind
Too often, institutions use general language such as “struggling students” without identifying which indicators should actually trigger review, leading to inconsistent intervention decisions across courses and programs.
This matters because effective intervention strategies for struggling students depend on identifying patterns rather than reacting to one isolated event.
That process becomes more effective when assessment data is tied to competencies and learning outcomes. When exam items are consistently tagged, institutions can move beyond raw scores and identify meaningful performance gaps earlier. Tools like CompetencyGenie™ help standardize exam item tagging, making it easier to connect assessment results to broader intervention efforts.
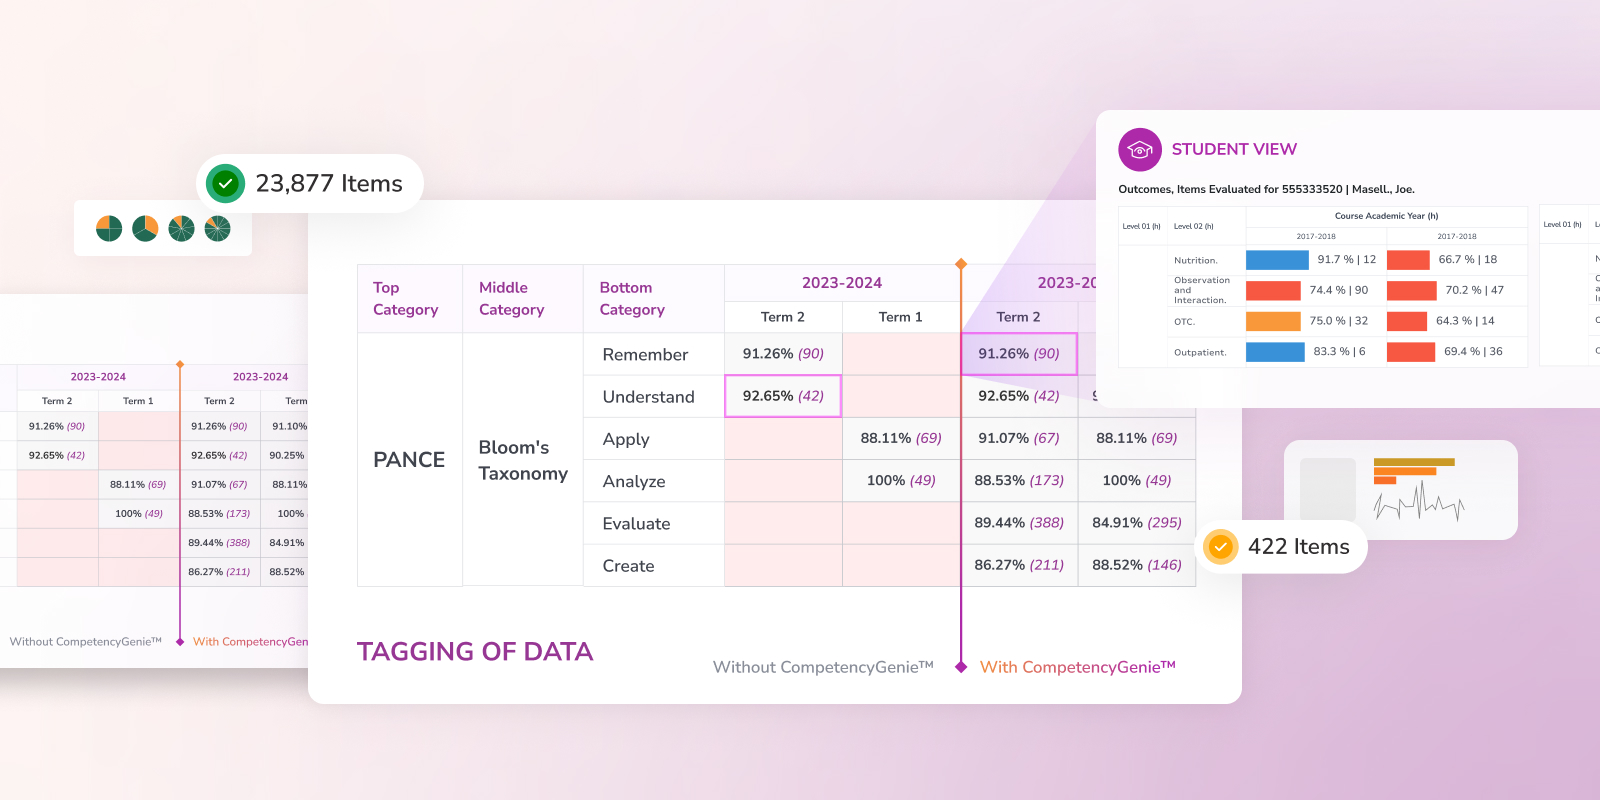
AI-supported tagging also helps institutions align assessment content more efficiently to competencies, standards, and learning outcomes. That improves the quality of reporting and makes it easier to identify where students are struggling with greater specificity.
Instead of saying, “This student failed an exam,” faculty and assessment leaders can begin saying, “This student is consistently underperforming in a specific outcome area.” That distinction leads to better remediation steps and a more effective intervention in higher education.
Case Study
Learn how the University of Charleston School of Pharmacy used learning analytics to improve student retention and successfully prepare for the reaccreditation
Bring academic signals into one view
An intervention plan only works if the right people can see the right signals at the right time. In practice, that means institutions need visibility across the systems where student performance is already being recorded.
When those signals are brought together in Enflux, institutions can interpret student performance in a more connected way. Canvas LMS data can help surface patterns in course engagement, assignment completion, and academic activity that may signal emerging concern before a major decline is visible in final grades. ExamSoft assessment data adds another layer by helping institutions examine recurring patterns in performance, identify outcome-level weaknesses, and better understand where structured academic support may be needed. When exam items are consistently tagged, those patterns become even more meaningful across courses and over time.
On-demand webinar:
Blackboard, now available as a new Enflux integration, adds another important dimension to that connected view. Institutions can expand visibility into course participation, grade trends, assignment-level performance, and missed work signals, with dashboards designed to support faculty, advisors, and mentors in reviewing student progress from their own institutional roles.

The value lies not in any one platform on its own, but in what becomes visible when these data sources are reviewed together. A student may show declining engagement in Canvas or Blackboard before a significant drop in performance appears. ExamSoft may then reveal that the issue is concentrated in specific content areas or competencies rather than reflecting broad academic decline.
When aggregated and reviewed in Enflux, this data can help institutions:
- Identify academic risk before it becomes course failure
- Connect student engagement with underlying performance patterns
- Detect recurring gaps across outcomes, competencies, and courses
- Direct support toward students with the clearest evidence of need
This kind of connected visibility strengthens student intervention strategies by helping institutions act earlier and with better academic context.
Document intervention in a way that supports continuous quality improvement (CQI)
Many institutions already support struggling students. The challenge is that those efforts are not documented properly.
A faculty member sends an email. An advisor holds a meeting. A tutor provides guidance. But unless those actions are documented in a shared process, it becomes difficult to answer important questions:
- Why was the student flagged?
- What support was assigned?
- Who is responsible for follow-up?
- Did the student improve?
That level of documentation matters not only for student support and advising, but also for institutional quality assurance. Across higher education, and especially in health professions education, accreditors increasingly expect programs to show how students are identified, supported, and monitored over time as part of a broader CQI process.
In that context, a strong student intervention plan should do more than alert a team that a student is in trouble. It should create a documented process for recording the intervention, the actions taken in response, and the outcome that followed.
ActionPlans® Management System by Enflux helps institutions turn intervention from informal discussions into structured, documented practices that support accreditation readiness. Programs can capture the specific data view that prompted a decision, assign responsibility to an individual or committee, define milestones, and track completion over time.

When intervention is documented this way, institutions are in a stronger position to show not just that support was offered, but how it was carried out and what it changed.
Providing a stronger model for early intervention
For institutions looking to strengthen intervention plan for at-risk students and improve remediation, the real advantage is not simply access to more data. It is the ability to connect evidence, decision-making, and follow-through in a way that supports student success over time.
Enflux helps institutions build that model by connecting the systems programs already use and extending the process through AI-supported tagging and ActionPlans® workflows.
Want to build a more effective early intervention plan for at-risk students?
Explore how Enflux connects LMS, assessment, and intervention data to help institutions identify risk earlier, coordinate support, and document follow-through.